Whether via in-store signage, paper circulars, digital circulars, store apps, or other means, weekly meat and poultry features have long captured shoppers’ attention. In fact, circulars and apps almost always highlight meat department items on page one because fresh (particularly meat) draws consumers to stores.1 Because of this draw, retailers have run at least 12.1 million meat & poultry ads in each of the past several years, although the 2017 12.7 million-total tapered slightly in 2018 to 12.4 million ads.2
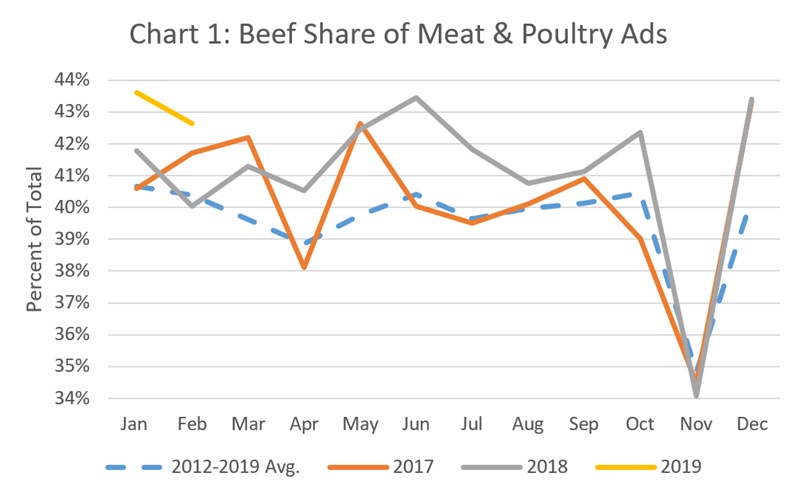
Beef has long been a particularly attractive feature, as baskets with beef nearly double the average trip ring, while carts with beef drive 44% more sales across the store than those with chicken.3 Given this important role in driving total store sales, retailers typically feature beef more often. Since 2012, beef ads have accounted for 39.6% of meat & poultry features, with this share reaching 41.1% in 2018.4 Over the same 2012-2018 time-period, chicken, pork and turkey accounted for 27.0%, 22.9% and 8.0% of ads, respectively, while lamb and veal accounted for the remaining 2.8%.5 Other than November when featuring turns to turkey, or Easter, which has traditionally favored ham (although beef ad counts around Easter have been inching higher), beef’s strong featuring share remains quite steady throughout the year (Chart 1).
Diving into beef featuring data, primal and cut ads have averaged 80% of the total since 2012, with the 20% balance for Ground Beef (Chart 2). 2018 was a particularly robust year for Ground Beef ads (22%), and this share has increased slightly each year since 2014. That said, Loin cuts (including Sirloin) still accounted for the greatest share of beef ads in 2018 (24%), followed by Round, Chuck and Rib. The higher share of Ground Beef ads primarily replaced those for Carcass items (e.g. Cubed Steak, Stew Meat, Strips, etc.) and Chuck cuts.
To read the rest of the story, please go to: The Beef Checkoff

